Logging and Metrics
Logs
You can see important Logs regarding the different life-stages of your Project in the Project Overview section. You can also find more detailed Runtime Logs for all your active deployments in the Logs section of your Project Detail page.
1. Build Overview
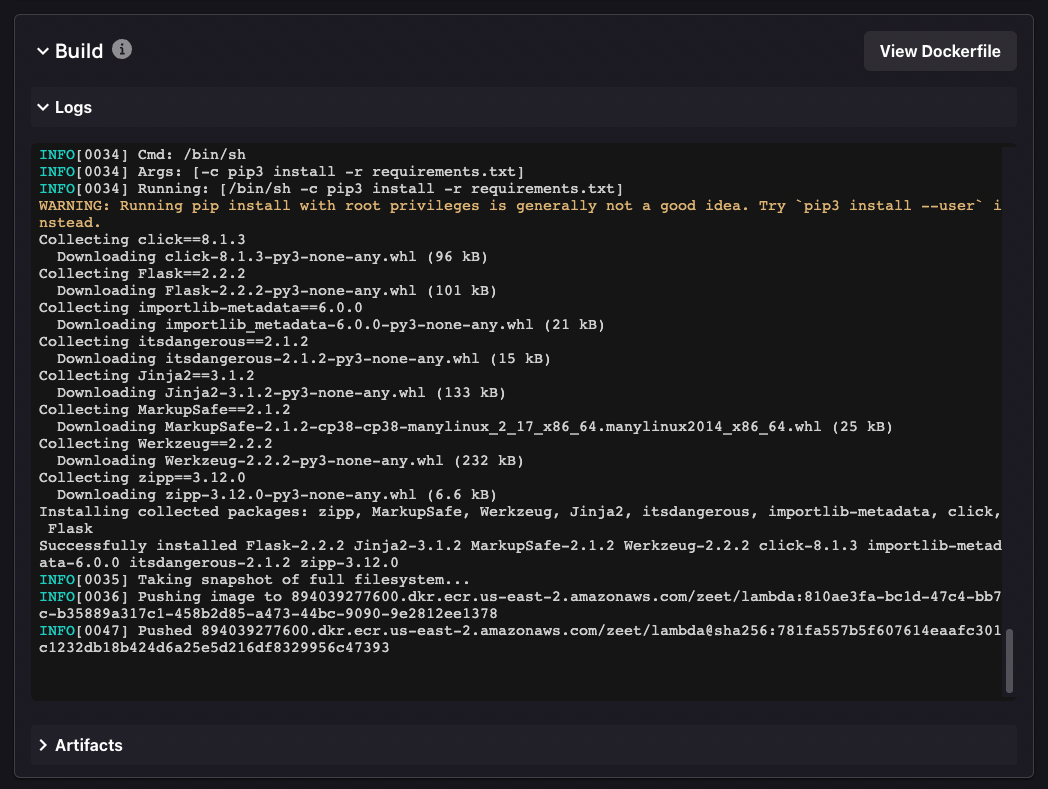
In the Overview section, under Build you can find the Build Logs, Artifacts, and Dockerfile used for your Build.
Build Logs
Build logs are a record of the events that occur during the build process of a software application or system, which can be used for troubleshooting issues and diagnosing problems. They provide detailed information on the steps taken during the build, including any errors or warnings encountered.
If you are seeing a BUILD FAILED for your Project, the Build Logs is a good place to start troubleshooting.
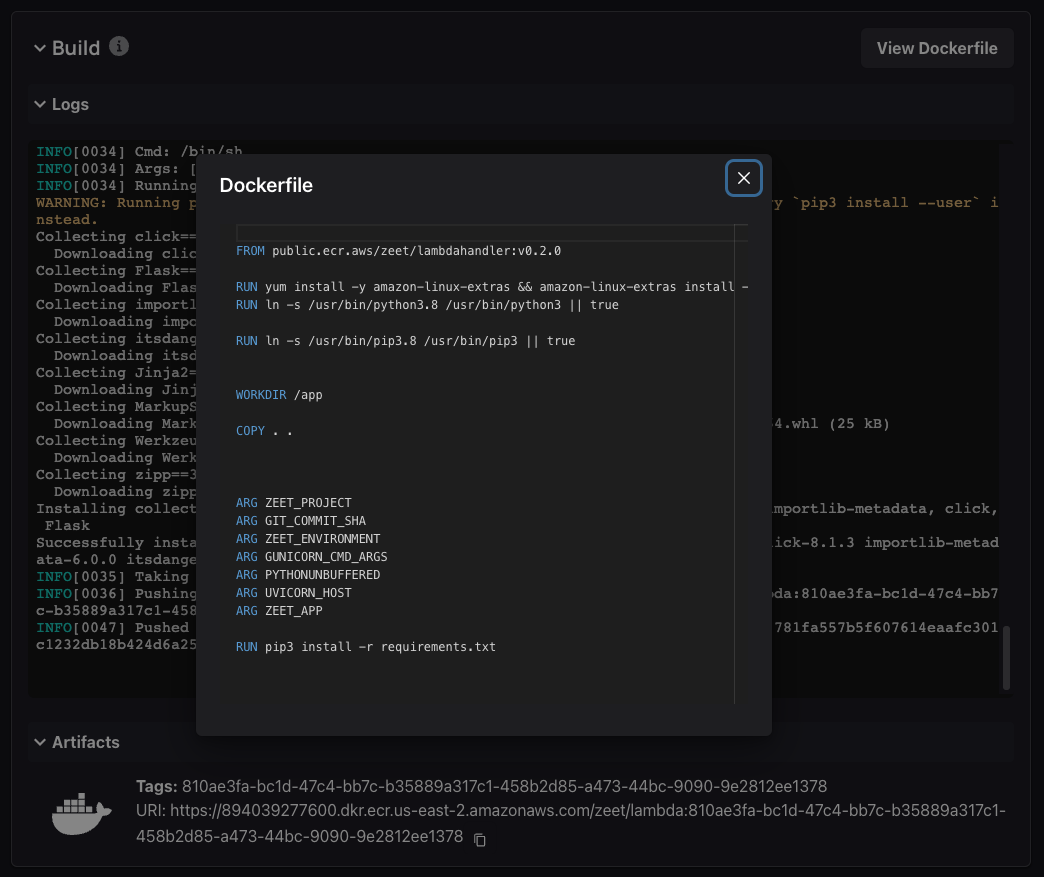
Dockerfile
A Dockerfile is a text file that contains a series of instructions for building a Docker image. It specifies the base image to use, the application code to add, the dependencies to install, and the commands to run when the container starts.
Even for Serverless Deployments, Zeet first creates a container images and pushes it to ECR (Elastic Container Registry) or GCR (Google Container Registry) depending on the Blueprint used for your Project. Zeet then uses this container to deploy your Project as a Lambda Function or Cloud Run Instance.
You can see the Dockerfile Zeet uses to build your container by clicking the View Dockerfile button next to your Build Logs.
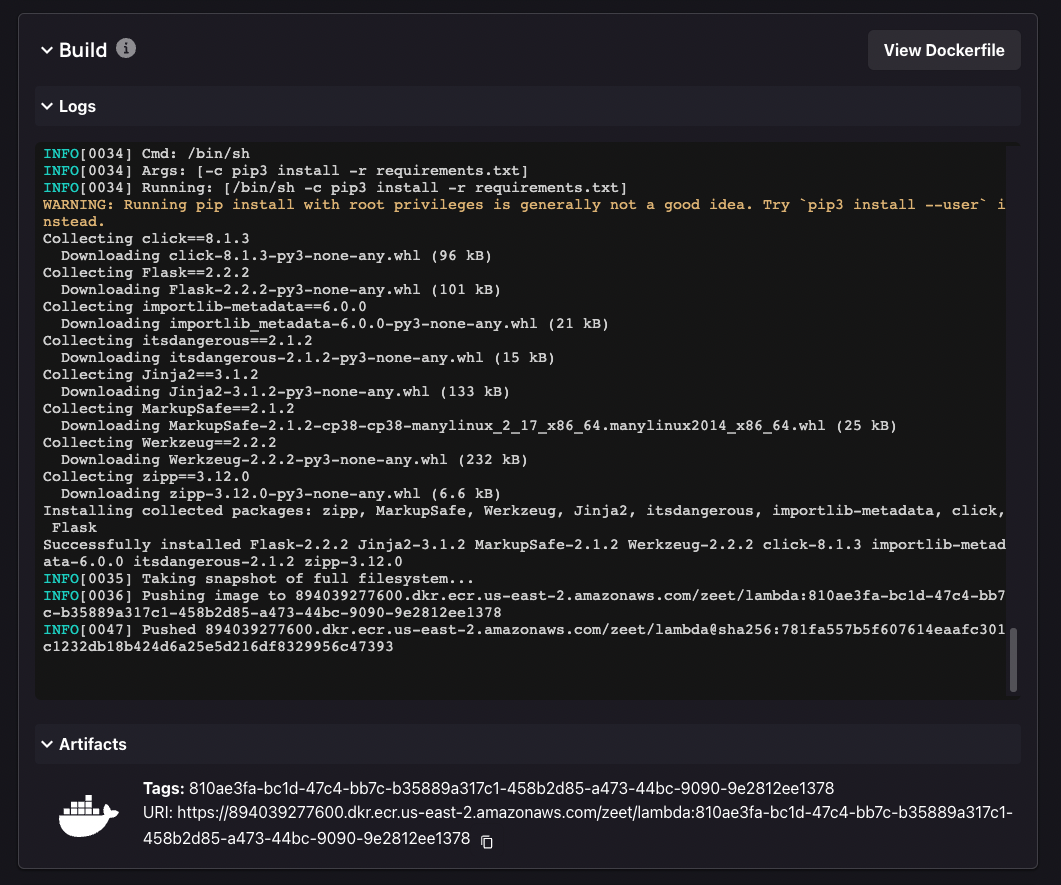
Build Artifacts
Build artifacts are the output generated by the build process of a software application or system, such as binaries, libraries, configuration files, and other resources. They are the result of compiling and linking source code, and can be deployed and tested in various environments.
You can see the Build Artifacts generated by the Zeet builder below the Build Logs by expanding the Artifacts section.
2. Deploy Overview
In the Overview section, under Deploy you can find Deploy Logs and Deployment Manifest used for deploying your Project.
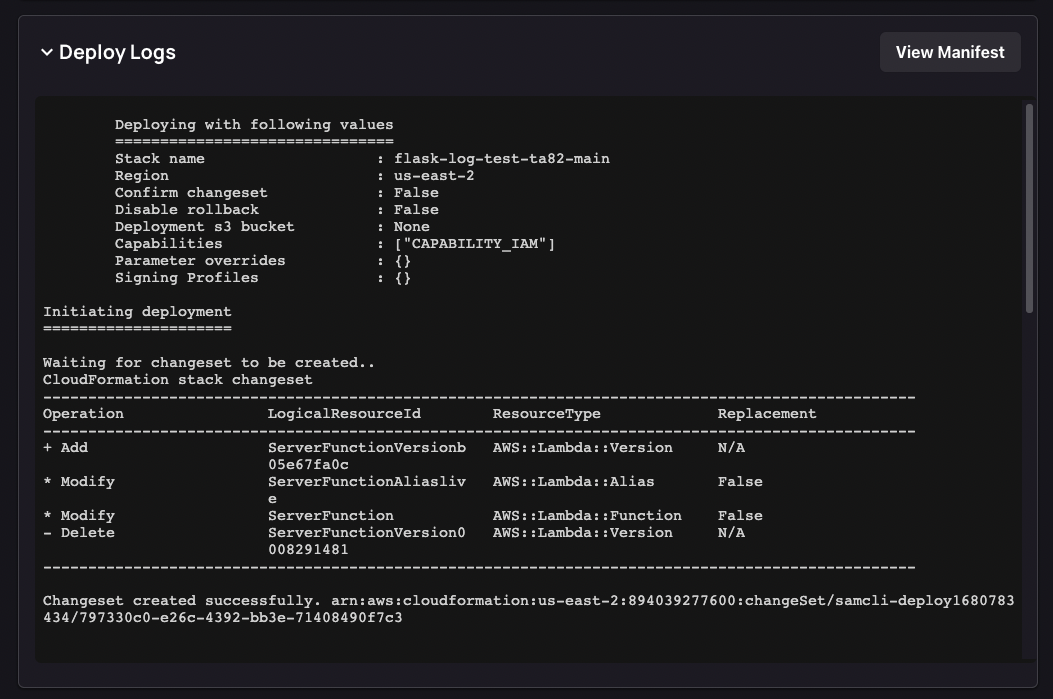
Deploy Logs
Deploy logs are a record of the events that occur during the deployment process of a software application or system, which can be used to troubleshoot issues and diagnose problems. They provide detailed information on the steps taken during the deployment, including any errors or warnings encountered.
If you are seeing a DEPLOY_FAILED for your Project, the Deploy Logs is a good place to start looking.
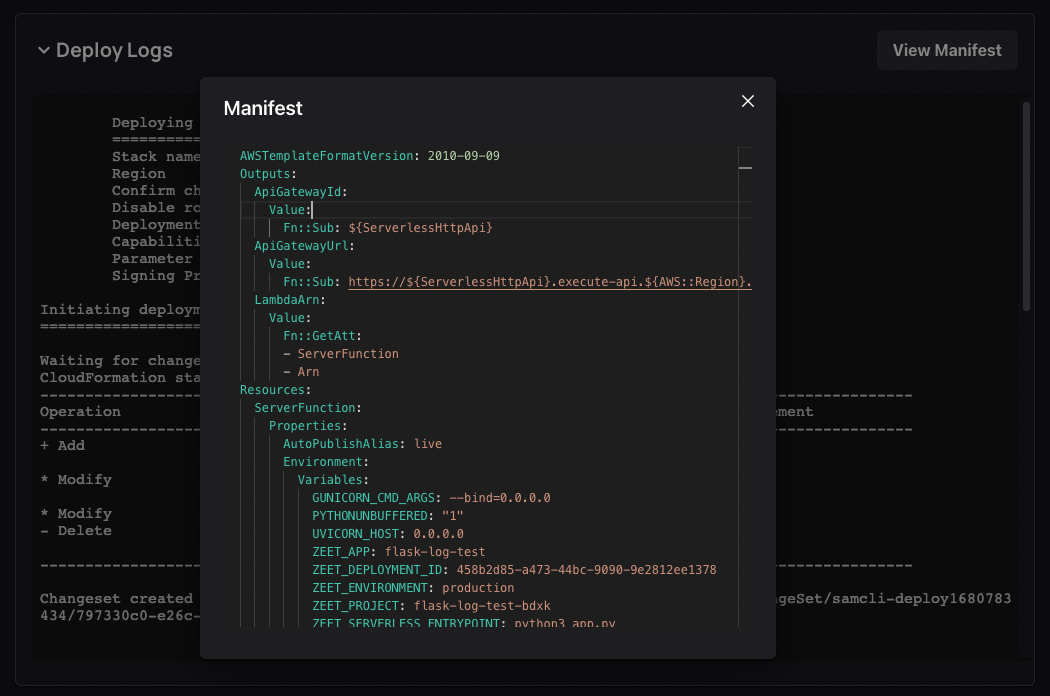
Deployment Manifest
A deployment manifest is a configuration file used to define the desired state of a software deployment, including the resources and settings required to run the application. It specifies the container image to use, the environment variables to set, the network settings, and other parameters necessary for the deployment.
You can see the Deployment Manifest for your Project by clicking the View Manifest button next to your Deploy Logs.
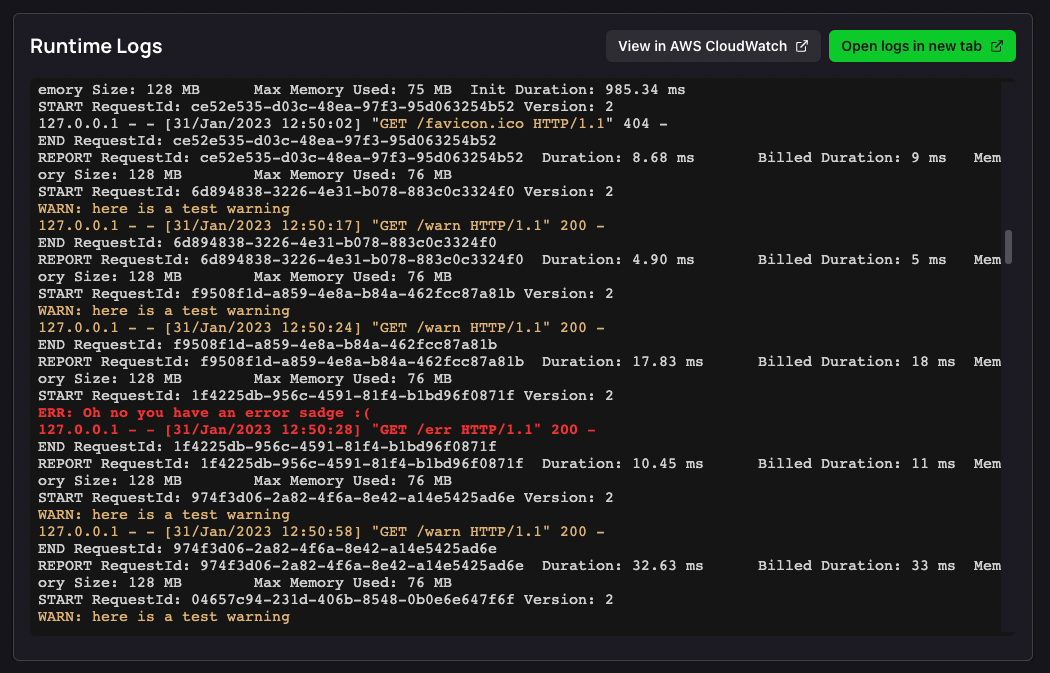
3. Runtime Logs
In the Overview section, under Runtime Logs you can find the Runtime Logs for your active Deployment.
Metrics
Zeet provides useful metrics of your Project's performance and behavior. You can find these in the Metrics tab of your Project Detail page.
The available metrics depend on the type of Blueprint used for creating your Project.
For Docker Blueprints that deploy into your cluster, the available metrics are:
- CPU Usage
- Memory Usage
- Network Out
- Disk Usage
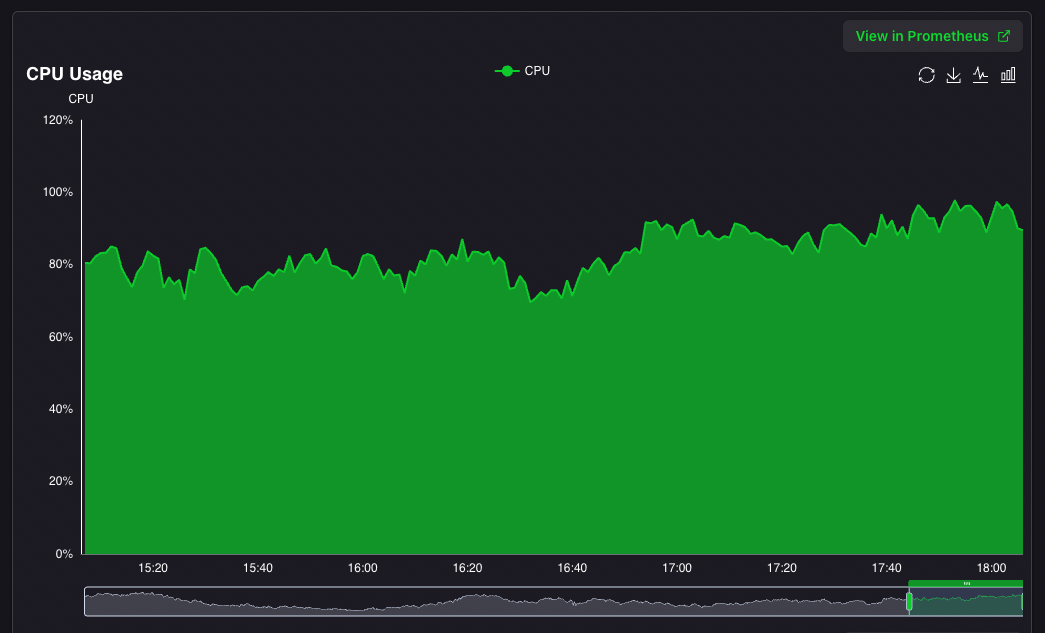
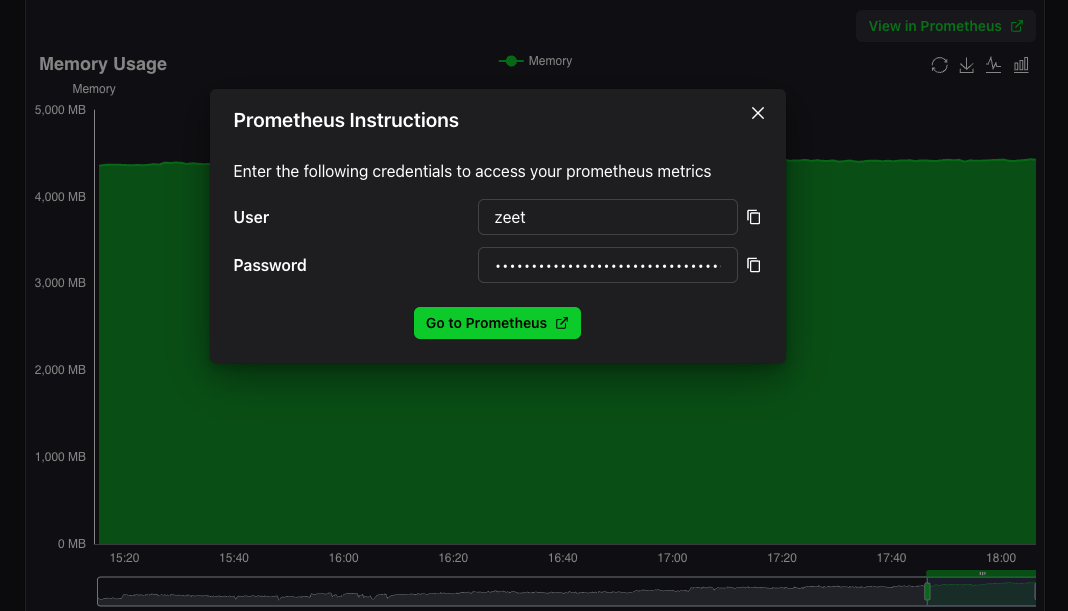
Zeet also automatically creates a Prometheus instance when creating your cluster. You can use the View in Prometheus button to view advanced metrics in Prometheus.
For GCP Cloud Run Blueprints, the available metrics are:
- Request Count
- Instance Count
- CPU Utilization
- Memory Utilization
For AWS Lambda Blueprints, the available metrics are:
- Function Invocations
- Function Errors
- Function Duration
- Concurrent Executions
Resources
- Prometheus: Official Prometheus website
- Lambda functions using Container Images: AWS Docs
- Cloud Run using Container Images: GCP Docs