Prometheus Integration
Prometheus is an open-source monitoring and alerting system that enables users to gather and monitor metrics from their clusters. It provides insights into crucial metrics like CPU and memory utilization for all running pods in the cluster, ensuring performance monitoring and resource optimization.
Prometheus is a Cloud Native Computing Foundation project, and the de facto standard for monitoring Kubernetes clusters.
Prometheus for your cluster
When you create a Kubernetes cluster via Zeet, Prometheus is installed by default.
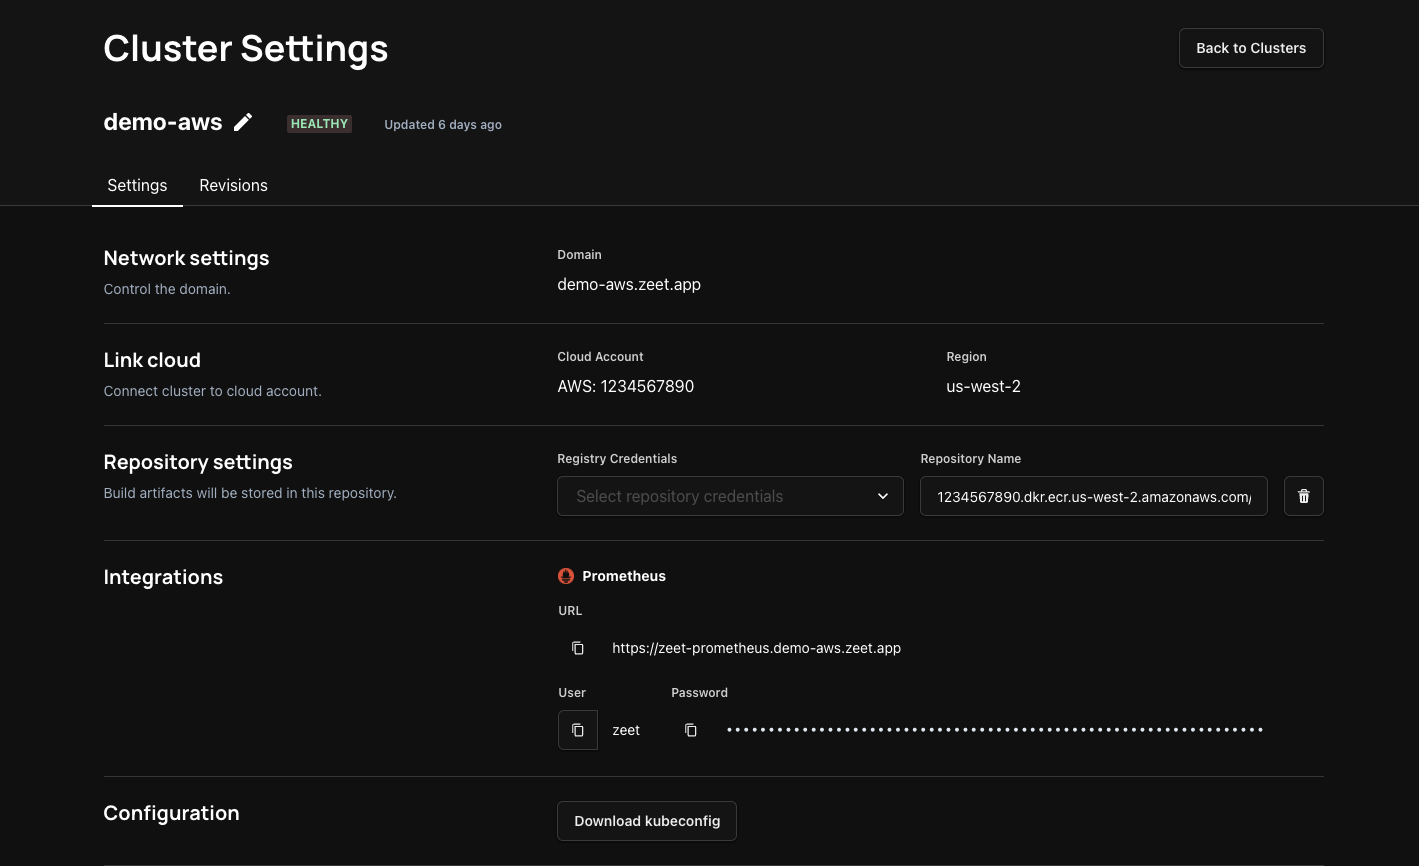
Prometheus provides a web dashboard which is protected by basic authentication. To find the authentication credentials, navigate to the cluster page and look for the Integrations section.
Application Metrics
Prometheus works by pulling metrics from your deployments over HTTP. This is referred to as "scraping".
Service Container & Job Container Projects
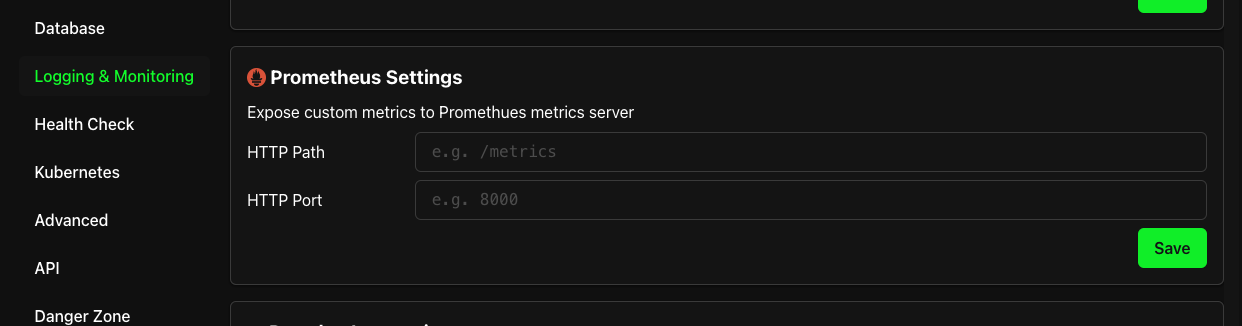
To expose metrics for Prometheus to track, you can configure the Prometheus "scrape endpoint" in the Logging & Monitoring section of your project settings.
Other Project Types
Prometheus automatically discovers your application Services and Pods via "service discovery".
To make your Kubernetes Services or Pods discoverable by Prometheus, configure annotations like so:
  annotations:
    prometheus.io/scrape: "true"
    prometheus.io.scheme: "https"
    prometheus.io/path: "/metrics"
    prometheus.io/port: "8558"
This will instruct prometheus to scrape metrics over https at <host-ip>:8558/metrics.
If you use Helm to deploy your application, many Helm charts configure these annotations by default, or allow you to configure them via Helm values.