Kubernetes Troubleshooting Guide
This troubleshooting guide covers the different categories of failures with information about the failures as well as tips to debug and resolve these issues. This guide will be applicable to you as long as you are using a cluster on Zeet, regardless of provider (AWS, GCP, DO, Coreweave, etc.).
Understanding Zeet Project Statuses
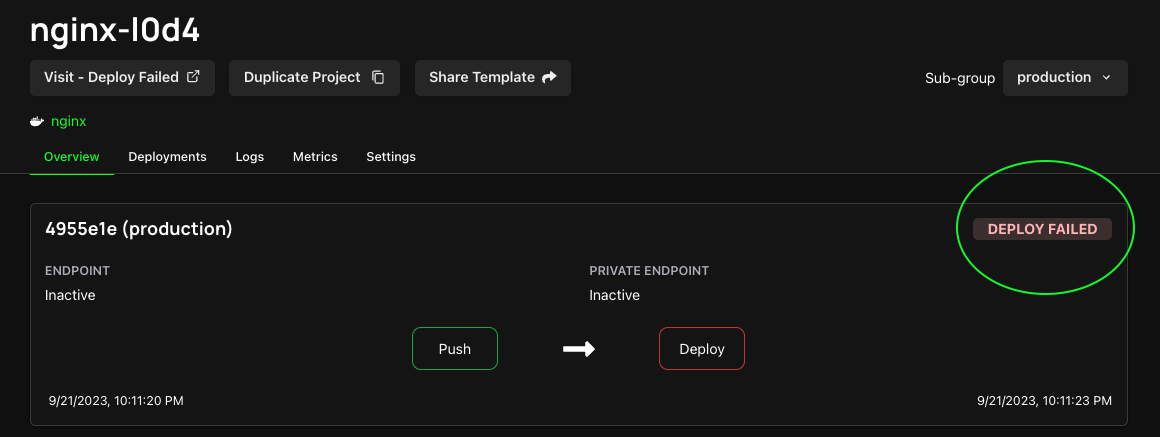
If there is a failure deploying your Container Project to your Cluster, Zeet you will show a status indicator for your Project explaining the type of failure so you can debug:
| Status Indicator | Category | Description |
|---|---|---|
BUILD_FAILED | Build Failures | Issues related to the building process. |
CRASHING | Application Failures | Runtime issues that cause your container to crash. |
DEPLOY_FAILED | Kubernetes Control Plane Failures | Issues thrown by the Kubernetes control plane. Typically requires the expertise of an Infrastructure or Platform Engineer. |
You can see the status of your Project in the Project Overview page as shown in the picture below.
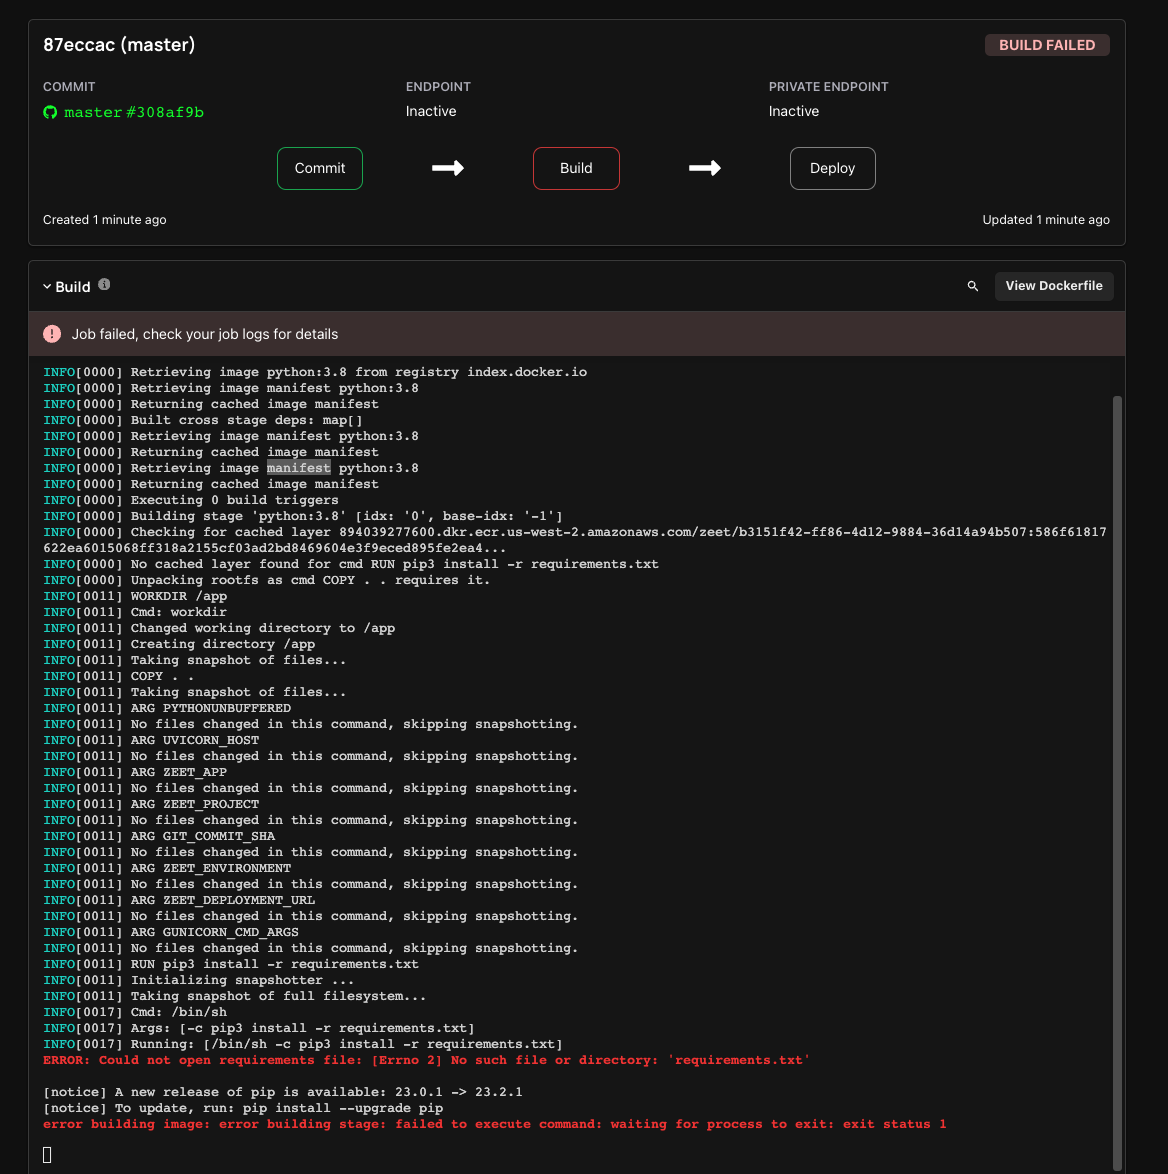
1. BUILD_FAILED - Build Failures
If your Project has a BUILD FAILED label, it means the project is failing in the build stage. You should check the Zeet Build Logs for your project to debug.
| Problem | Potential reason | How to debug |
|---|---|---|
| Build failed | Bad dockerfile | Debug by examining logs and rebuilding. |
| Build failed w/ logs missing | Logs purged by k8s | Once logs are purged, debugging becomes challenging. Zeet forwards all logs to CloudWatch by default - check your cloud console for more details. |
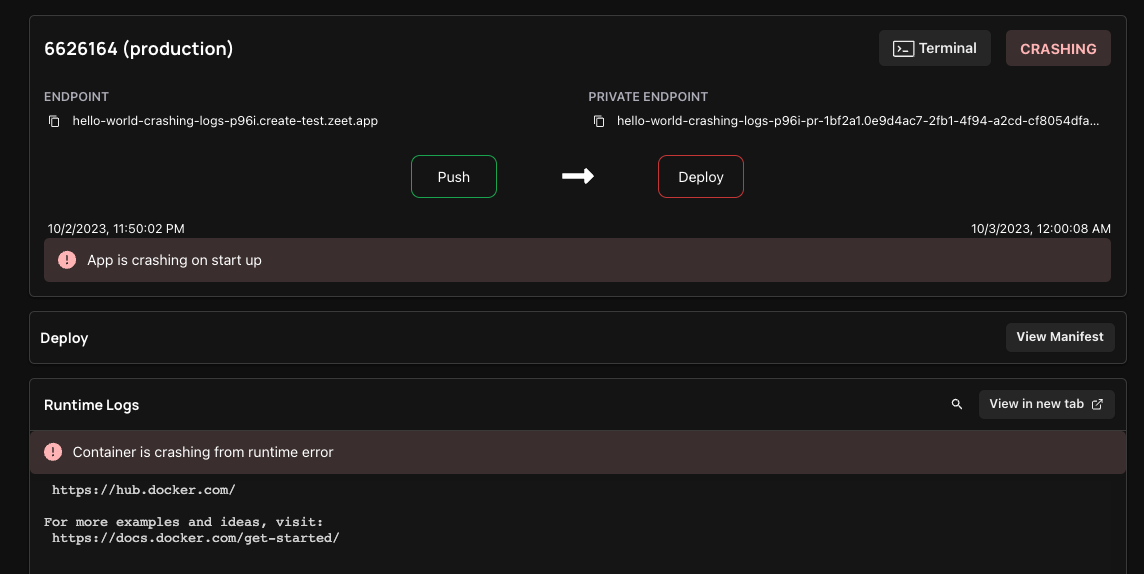
2. CRASHING - Application Failures
If you Project is showing a CRASHING state, it means your Project successfully deployed, but later crashed. This typically means that you are facing some Runtime errors either due to a bug in your application or some misconfiguration. These can be identified and resolved by inspecting the Runtime Logs for your Project in Zeet.
| No. | Symptom | Potential Reason | How to Debug |
|---|---|---|---|
| 1 | Health check probe failed | Probe is configured incorrectly | Run kubectl pod logs to inspect whether the service has been started successfully. Then run kubectl describe deployment to inspect probe config. |
| Application fails to start due to bugs | Inspect pod logs by running kubectl pod logs. | ||
| Dependency is configured incorrectly | Inspect pod logs by running kubectl pod logs. | ||
| 2 | Endpoint doesn't work | Port is not exposed | Inspect pod logs by running kubectl pod logs, test connectivity with ephemeral containers, review target group targets (if any), and check resource creation states using the cloud provider panel. |
| Health Check not configured | Check Zeet Health Check tab in Project settings and run kubectl describe deployment to verify probe configuration. | ||
| 3 | Pod constantly crashing | Application bug | Inspect pod logs by running kubectl pod logs. |
| Application bug, but pod deleted after crashing | Go to CloudWatch (or another log forwarding storage) and inspect historical logs. | ||
| 4 | Cannot view custom logging | Design choice; user uses a custom logging stack | This may not be fixable. At best, a message may indicate that logs are stored elsewhere. |
| Pods deleted by Kubernetes | Go to CloudWatch. | ||
| 5 | Application stuck at deploy failure state (tentatively) | Port configured incorrectly, causing the revision to be not ready and unable to serve traffic | Inspect Runtime Logs in Zeet, or inspect pod logs by running kubectl pod logs. |
| 6 | Application crash at startup | Application misconfiguration or bugs | Inspect pod logs by running kubectl pod logs; if nothing is found, describe the pod for hints. |
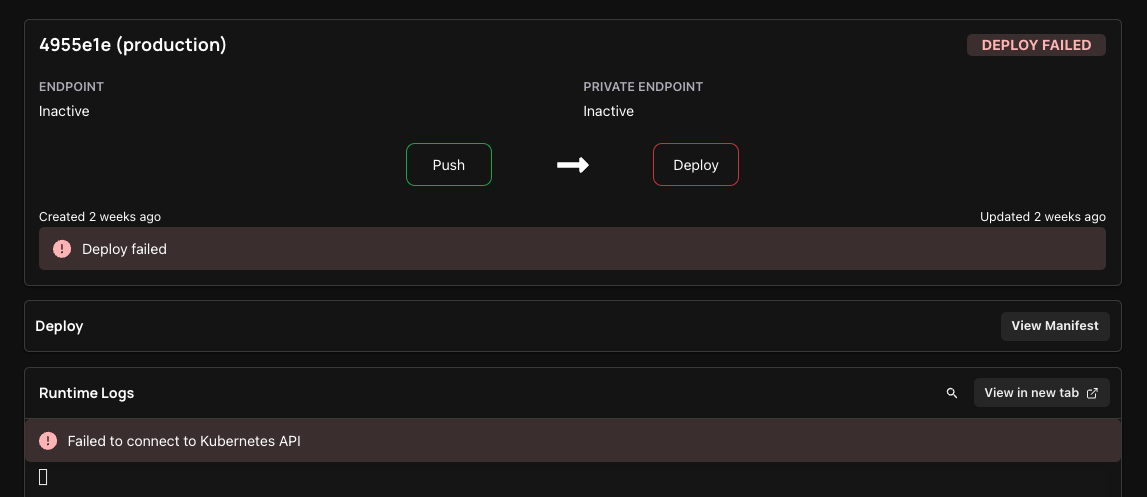
3. DEPLOY_FAILED - Kubernetes Control Plane Failures
When your Project is showing a DEPLOY FAILED state, it means your Project was successfully built, but you're encountering issues with the application not starting or remaining unhealthy. This problem likely lies within the Kubernetes control plane.
| No. | Problem | Reason | How to Debug (Infrastructure Engineer) | How to Fix (User) | Where to Find Details (User) |
|---|---|---|---|---|---|
| 1 | Deployment Failure | Container pull issue | Examine deployment details by running kubectl describe deployment. | Check container URL, registry status, and authentication. | Use Lens or kubectl. Refer to Kubernetes Container Documentation. |
| CrashLoopBackOff | Inspect deployment and pod logs. Consider ephemeral containers or direct pod inspection. | Examine health probe status and pod logs. Fix application bugs if needed. | Use Lens or kubectl. Refer to Kubernetes Pod Failure Documentation. | ||
| Connectivity issue between containers | Review pod logs and inspect deployment configuration by running kubectl edit deployment. | ||||
| 2 | Cluster Connection Issue | Cloud provider SLA | Check cloud provider status page | Verify cloud provider status. Wait for resolution or file a ticket if necessary. | AWS Health and Google Cloud Status |
| User removed Zeet Access | Check Zeet cluster console for health. If not healthy, perform a no-op through the cloud provider API. | Re-authorize Zeet access to your cloud provider environment. | |||
| Zeet - Customer K8s Networking | Check Zeet cluster console for health. If not healthy, perform a no-op through the cloud provider API. | Check if the upstream and/or application are still operational. If the issue persists, consider opening a support ticket with Zeet for assistance. |